Business inventories sales ratio sets the stage for understanding how companies manage their resources effectively, blending data analysis with real-world business decisions. This ratio stands as a key indicator, helping businesses and analysts alike decode the delicate balance between inventory levels and sales performance.
At its core, this metric reveals how quickly inventory is turning over in relation to sales, offering insights into supply chain efficiency, market demand, and potential areas for operational improvement. It’s widely used across industries like retail, manufacturing, and wholesale, serving as a touchstone for financial health and strategic planning. By honing in on this ratio, organizations can anticipate trends, respond to market shifts, and optimize their inventory management to stay ahead of the competition.
Business Inventories Sales Ratio: Understanding Its Role in Modern Business Analysis
The business inventories sales ratio is a fundamental metric in the world of finance and operations, providing essential insights into the relationship between a company’s inventory levels and its sales. Known for its relevance in both macroeconomic and business-specific analyses, this ratio serves as a key indicator of supply chain efficiency, inventory management, and overall business health across various industries.
Definition and Purpose of Business Inventories Sales Ratio
The business inventories sales ratio measures the amount of inventory a business holds compared to its sales over a specific period. In essence, it tells you how many months’ worth of sales is represented by the current inventory levels. This ratio is particularly useful for analysts and decision-makers seeking to gauge how efficiently a business or sector is managing its stock relative to demand.
Monitoring this ratio provides early warning signs for potential overstocking or understocking situations, which can directly impact cash flow, storage costs, and the ability to respond to market changes. It’s highly relevant in industries like retail, manufacturing, and wholesale trade, where inventory turnover is critical to profitability and operational agility.
Calculation Methods and Key Components
Calculating the inventories sales ratio involves dividing the value of inventories by total sales within a set period, usually monthly or quarterly. The process requires accurate data on both inventory valuation and sales figures.
Inventories Sales Ratio = Total Inventories / Total Sales
The primary components are:
- Inventories: The value of all goods held for sale at the end of the period, measured either at cost or market value.
- Sales: The total value of goods sold during the same period, excluding returns or allowances.
To clarify, here’s an example dataset showing how the ratio is calculated in practice:
| Period | Inventory Value ($) | Sales ($) | Inventories Sales Ratio |
|---|---|---|---|
| January | 120,000 | 60,000 | 2.0 |
| February | 100,000 | 50,000 | 2.0 |
| March | 80,000 | 80,000 | 1.0 |
These values suggest, for example, that in January and February, the company had two months’ worth of inventory relative to sales, while in March, inventory and sales were balanced.
Interpretation and Implications of the Ratio, Business inventories sales ratio
Understanding the implications of a high or low inventories sales ratio is vital for sound operational decision-making. Generally:
- A high ratio indicates that inventory levels are building up relative to sales, which can signal overstocking, declining demand, or inefficiencies in sales channels. This could lead to increased holding costs or the need for markdowns.
- A low ratio suggests inventory is turning over quickly in relation to sales, which may mean strong demand or, conversely, inadequate stock to meet customer needs, risking lost sales opportunities.
Typical scenarios based on these interpretations include:
- Increasing the ratio due to sluggish sales may prompt a business to launch promotions or reduce purchase orders.
- A declining ratio as sales outpace inventory could lead to ramped-up production or expedited restocking, especially in sectors with volatile demand.
Changes in the ratio can reveal much about supply chain efficiency and shifting consumer demand patterns, making it a key metric for proactive management.
Factors Influencing the Business Inventories Sales Ratio
Several internal and external factors can drive changes in the inventories sales ratio. Businesses need to account for these variables to interpret the ratio accurately and make informed decisions.
Some of the most significant factors include:
- Seasonality: Inventory builds before peak sales periods can temporarily inflate the ratio.
- Market Trends: Shifts in consumer preferences or economic downturns can reduce sales, raising the ratio.
- Supply Chain Disruptions: Delays from suppliers or logistical challenges may increase inventory for critical components or finished goods.
- Production Planning: Overestimation of sales forecasts can result in higher than necessary inventory levels.
The table below summarizes these factors and their typical impacts:
| Factor | Potential Impact on Ratio |
|---|---|
| Seasonality (e.g., holiday buildup) | Usually increases ratio before the peak, followed by a sharp decline after sales surge. |
| Supply Chain Disruptions | May increase ratio due to precautionary stockpiling or delays in moving inventory. |
| Market Demand Shift | Sudden drops in demand inflate the ratio; spikes in demand can lower it quickly. |
| Industry Type | Manufacturers often hold more inventory than retailers; tech firms may see faster turnover. |
Comparing across industries, for example, fashion retail typically faces more dramatic seasonal shifts than automotive manufacturing, while tech hardware companies may experience sudden swings due to innovation cycles.
Applications in Business Decision-Making
The inventories sales ratio is pivotal in shaping inventory management strategies and broader business decisions. By actively monitoring this metric, companies can proactively adjust their operations to maintain optimal stock levels and meet market demand efficiently.
Key operational adjustments driven by shifts in the ratio include:
- Scaling back inventory orders when the ratio climbs too high, mitigating the risk of obsolete stock.
- Implementing targeted promotions or clearance sales to reduce excess inventory.
- Increasing production or accelerating procurement of raw materials when the ratio drops, ensuring supply meets rising demand.
- Re-evaluating supplier contracts or logistics strategies in response to persistent inventory imbalances.
Financial analysts also incorporate this ratio into comprehensive assessments of business health, analyzing trends over multiple quarters to spot emerging risks or operational inefficiencies. When combined with other performance metrics, the inventories sales ratio helps paint a nuanced picture of a company’s agility and resilience.
Trends and Historical Context of Inventories Sales Ratios
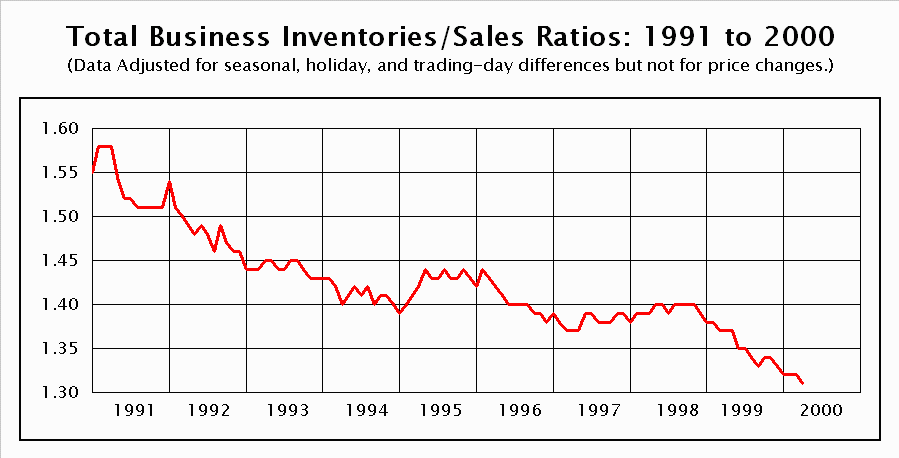
The inventories sales ratio has played a critical role in economic analysis, especially during major economic cycles. Its behavior often reflects underlying trends in the broader economy.
Throughout history, notable patterns include:
- Pre-2008 Financial Crisis: Inventory levels were relatively high as companies overestimated demand, contributing to inefficiencies once the recession hit.
- During the Great Recession (2008-2009): Sharp increases in the ratio as sales plummeted, forcing businesses to liquidate excess stock aggressively.
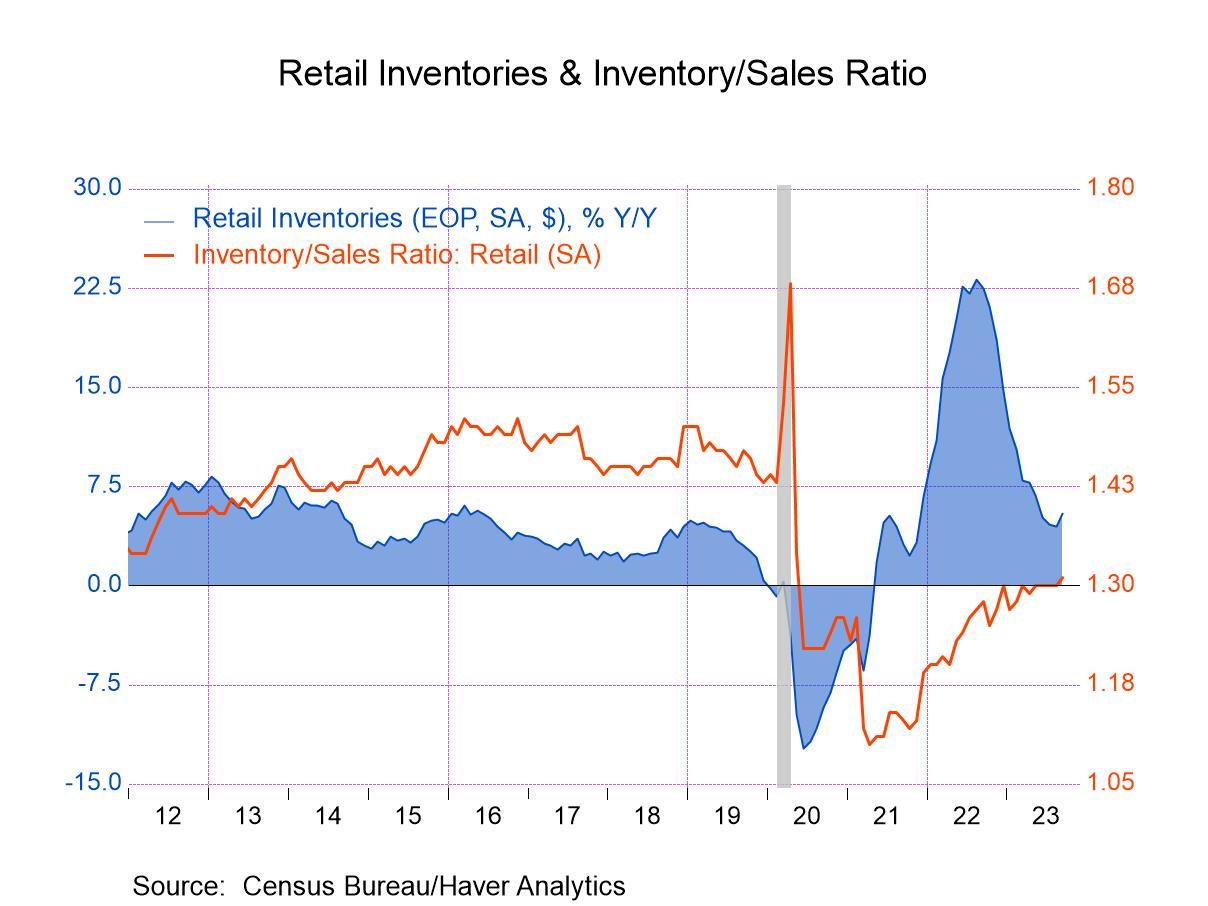
- COVID-19 Pandemic (2020): Extreme supply chain disruptions led to both stockouts and excess inventory, causing volatile swings in the ratio across sectors.
“In 2009, major automakers faced sky-high inventories sales ratios as consumer demand collapsed almost overnight. This forced a series of unprecedented plant shutdowns, mass layoffs, and government intervention to stabilize the sector.”
These periods underscore how shifts in the inventories sales ratio can foretell industry-wide challenges and drive dramatic operational responses.
Limitations and Considerations with the Inventories Sales Ratio

Although the inventories sales ratio is valuable, relying on it exclusively can lead to misinterpretations. Its limitations include:
- It does not account for inventory quality or obsolescence, which can undermine the accuracy of the analysis.
- The ratio may fluctuate significantly due to temporary market or supply chain anomalies, not necessarily reflecting underlying business health.
- Comparisons across industries can be misleading since optimal ratios vary by sector.
Common pitfalls include:
- Assuming a low ratio always signals strong sales, when it could indicate understocking or supply challenges.
- Misreading short-term spikes as long-term trends, prompting unnecessary operational changes.
For a more complete view, it’s best to analyze this ratio alongside other indicators such as inventory turnover ratio, days sales of inventory (DSI), and gross margin trends.
Best Practices for Monitoring and Utilizing the Ratio

To maximize the usefulness of the inventories sales ratio, businesses should implement structured monitoring and reporting processes. This helps ensure timely interventions and continuous improvement of supply chain operations.
Actionable recommendations include:
- Set regular review periods for ratio analysis, integrating the findings into monthly or quarterly business reviews.
- Assign responsibility to dedicated roles, such as supply chain analysts or finance managers, to track and interpret the ratio.
- Layer ratio analysis with qualitative insights from sales and market intelligence teams.
A structured approach can be organized as follows:
| Best Practice | Responsible Party | Monitoring Frequency |
|---|---|---|
| Monthly ratio calculation and trend analysis | Supply Chain Analyst | Monthly |
| Cross-referencing ratio with sales forecasting | Finance Manager | Quarterly |
| Integrating ratio insights into executive dashboards | Business Intelligence Team | Monthly/As needed |
For best results, businesses should embed inventories sales ratio tracking into their standard operating procedures, ensuring that the metric is discussed regularly alongside other key performance indicators. This integrated approach enables data-driven decisions that support both operational excellence and long-term growth.
End of Discussion

In summary, mastering the business inventories sales ratio equips businesses with a powerful tool for navigating dynamic markets and making informed operational decisions. By consistently monitoring this ratio and understanding the factors that influence it, companies can optimize their inventory strategies, minimize costs, and maintain a competitive edge. When used alongside other financial indicators, it leads to a more comprehensive perspective on business health and future opportunities.
Common Queries: Business Inventories Sales Ratio
What is considered a healthy business inventories sales ratio?
A healthy ratio varies by industry, but generally, a lower ratio indicates efficient inventory turnover. However, what’s optimal depends on the specific business model and market conditions.
How often should businesses check their inventories sales ratio?
Best practice suggests monitoring the ratio monthly or quarterly to catch trends early and make timely decisions.
Can the inventories sales ratio predict future sales trends?
While it can signal demand changes, it works best when combined with other metrics and market analysis for forecasting.
Is the inventories sales ratio useful for all business sizes?
Yes, businesses of all sizes can benefit from tracking this ratio, though larger firms may integrate it into more complex reporting systems.
What actions should a company take if the ratio increases suddenly?
A sudden increase may suggest slowing sales or excess inventory; businesses should review their sales strategies and inventory management practices to address potential issues.
